 While visiting with a Ph.D. grad student at a major university this past week, we discovered…
and
https://plot.ly/products/cloud/
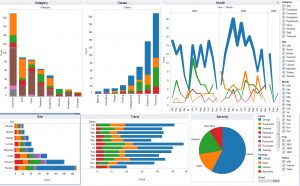
Both sites are redefining a user’s ability to display data in graphical form. Next time you’re looking for a way to visualize data, you might want to give one or both of these sites a try. They can help you build stunning graphs — to display compelling messages in visual form. Both have free or nearly free options. (Thanks Caleb!)


I haven’t used RAWgraphs dot io, but it is free and seems comparable to Tableau and Plotly.